
Timestamped mains outages
Every outage and restore is logged with its duration, ~3 s debounce.
Power Monitor
Cabinet and room surveillance: Timestamped mains outages · Temperature and humidity under alarm · 0.42" OLED display · web portal · MQTT publishing (SCADA) · 3D-printed enclosure · UPS power
Key features
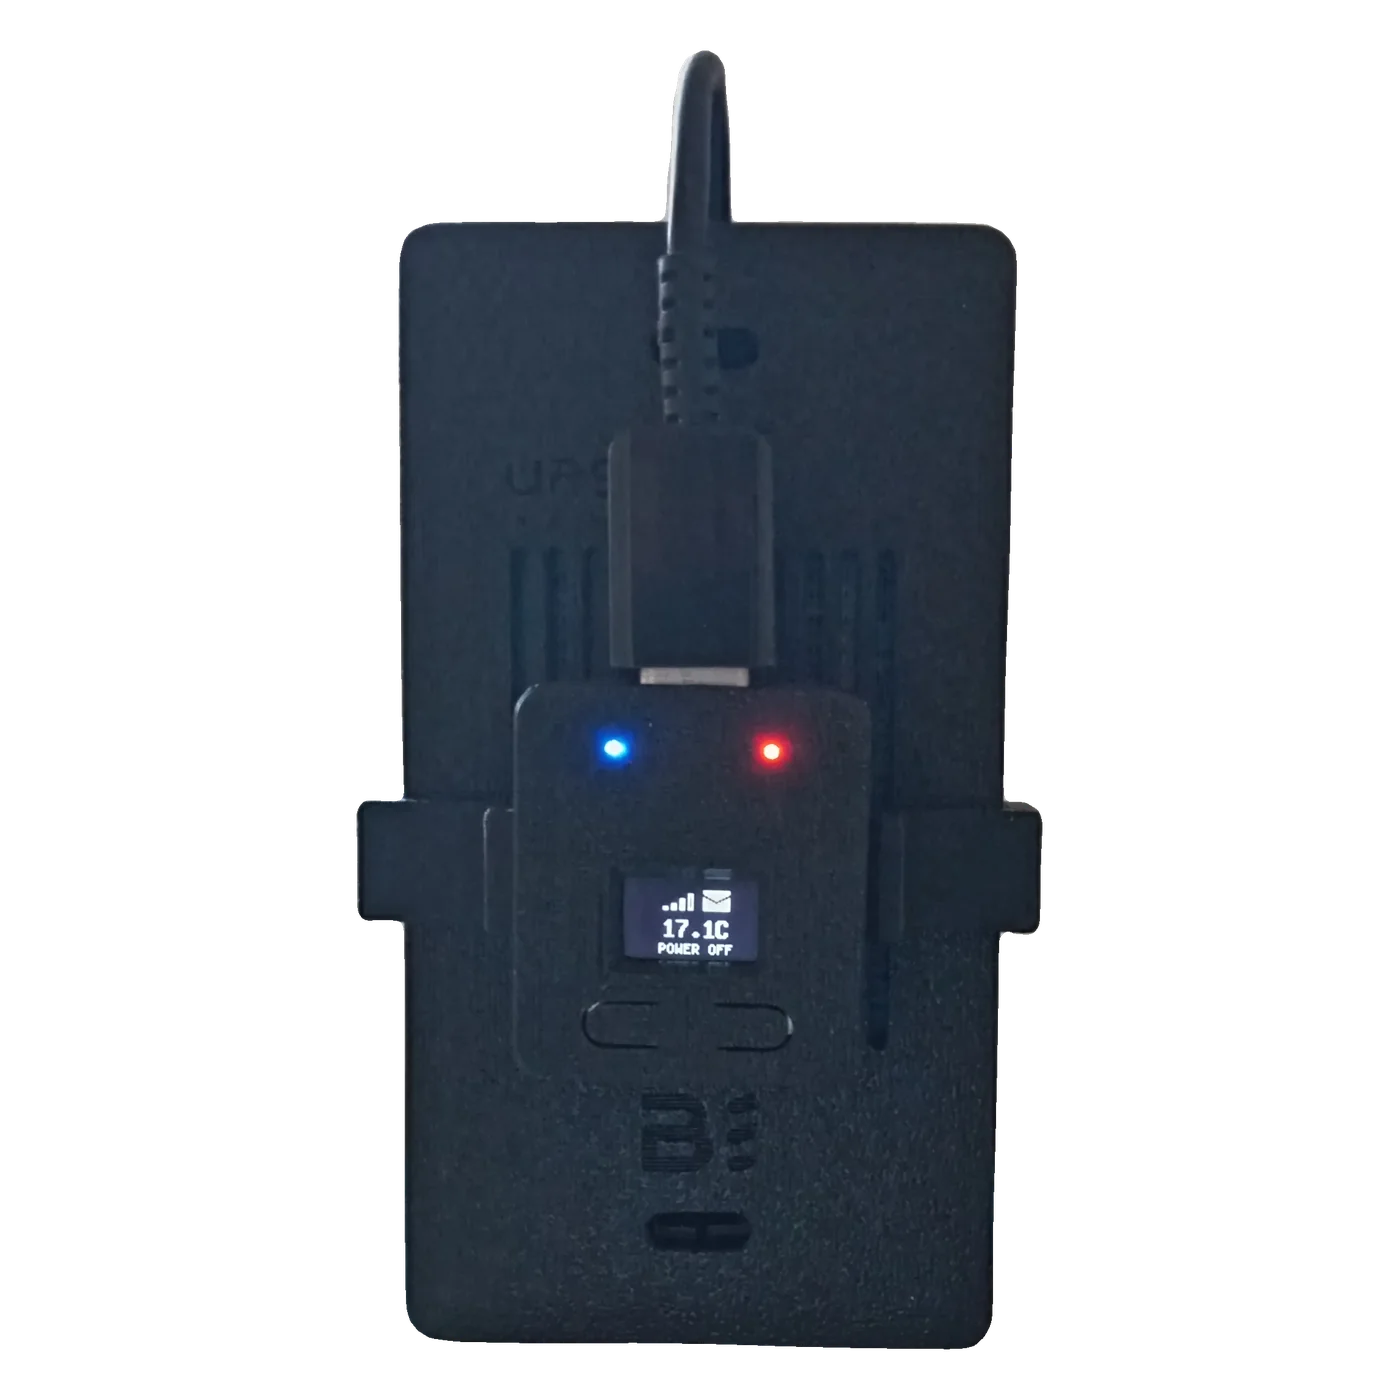
The Power Monitor shows power and climate status on site and pushes every event to your supervision.
Every outage and restore is logged with its duration, ~3 s debounce.
Min/max thresholds with hysteresis: the alarm goes out over MQTT the moment a limit is crossed — no nuisance trips at the setpoint.
Time, network, message, humidity and temperature at a glance — readable even while the sensor is warming up.
WiFi, MQTT, thresholds and timezone set from your phone: automatic hotspot or .local address, nothing to install.
Status, climate, events and alarms published under SCADA/<device>/… : your supervision consumes the readings as they are.
Ventilated shell, sprung battery bay and clip rail: it sits on UPS in minutes.
Specifications
| Processor | ESP32 |
|---|---|
| Display | 0.42-inch OLED |
| Climate sensor | Temperature and humidity sensor (auto-detected) |
| Clock | Battery-backed RTC (optional) or NTP |
| Mains detection | Optocoupler on GPIO — never a direct connection |
| Debounce | ~3 s — micro-outages are filtered |
| Log | Outages in non-volatile memory + RTC timestamps |
| Connectivity | WiFi + MQTT — topics SCADA/<device>/… |
| Configuration | Web portal — 192.168.4.1 or <device>.local |
| Power | 5 V USB-C from the UPS — keeps running through outages |
| Enclosure | 3D-printed — vented, battery bay, clip rail |
Outage log
Every outage and every restore is timestamped, with the event duration and a counter: you know exactly when the power went out and how long it was gone.
The event is written to non-volatile memory: even a total power loss of the unit cannot lose the incident.
When the network returns, the whole log is published over MQTT — your supervision picks up the events with no manual step.

UPS power
Powered by UPS, the Power Monitor keeps monitoring during the outage — it is the device that tells you how long it lasted.
The sprung battery bay takes the supplied cell: open in one gesture, replace with no tools and no enclosure disassembly.
The vented shell clips onto the cabinet rail — logic-side opto isolation, never a direct connection to the mains.
Benefits
Timestamps, durations and counters: no more “we had no idea” when a machine wakes up wrong the next morning.
Temperature and humidity thresholds, hysteresis against nuisance alarms, immediate MQTT publication — nobody has to chase anything.
Opto isolation on the GPIO, clip rail and web portal: the installation stays simple and isolated, with no programmer.
Tough box, BOOT button = portal in one press, readable display — the unit lives right among the machines.
FAQ
Mains presence is measured on a GPIO through an optocoupler: never a direct connection between the mains and the logic. A debounce of about 3 s filters micro-outages.
The event is written to non-volatile memory and the RTC keeps the time: on reboot, the unit finalizes the interruption with its exact duration.
Yes. The auto-detected temperature sensor reads temperature and humidity: min/max thresholds with hysteresis, alarm published over MQTT, readings every 60 s — the first 5 minutes stay hidden while the sensor warms up.
Everything is published over MQTT under SCADA/<device>/…: status, climate, events and alarms — your SCADA tools consume the readings as they are.
Through the web portal: automatic hotspot (192.168.4.1) or existing network, then WiFi, MQTT, thresholds and timezone configured via .local. A long press on BOOT reopens the portal.
The IT32B continuity tester checks 32 points in 1 second, right next to your line.
Discover the continuity testerProducts and solutions
Discover our other products and modules for a complete industrial solution.
Cabinet, server room or generator: we size the Power Monitor and the MQTT pipeline within 24 hours.